
EV Charging Stations in Parking Lots: Revenue and ROI
What EV charging adds to parking lot revenue, installation cost ranges, payback periods, and which sites benefit most from Level 2 vs DC fast charging.
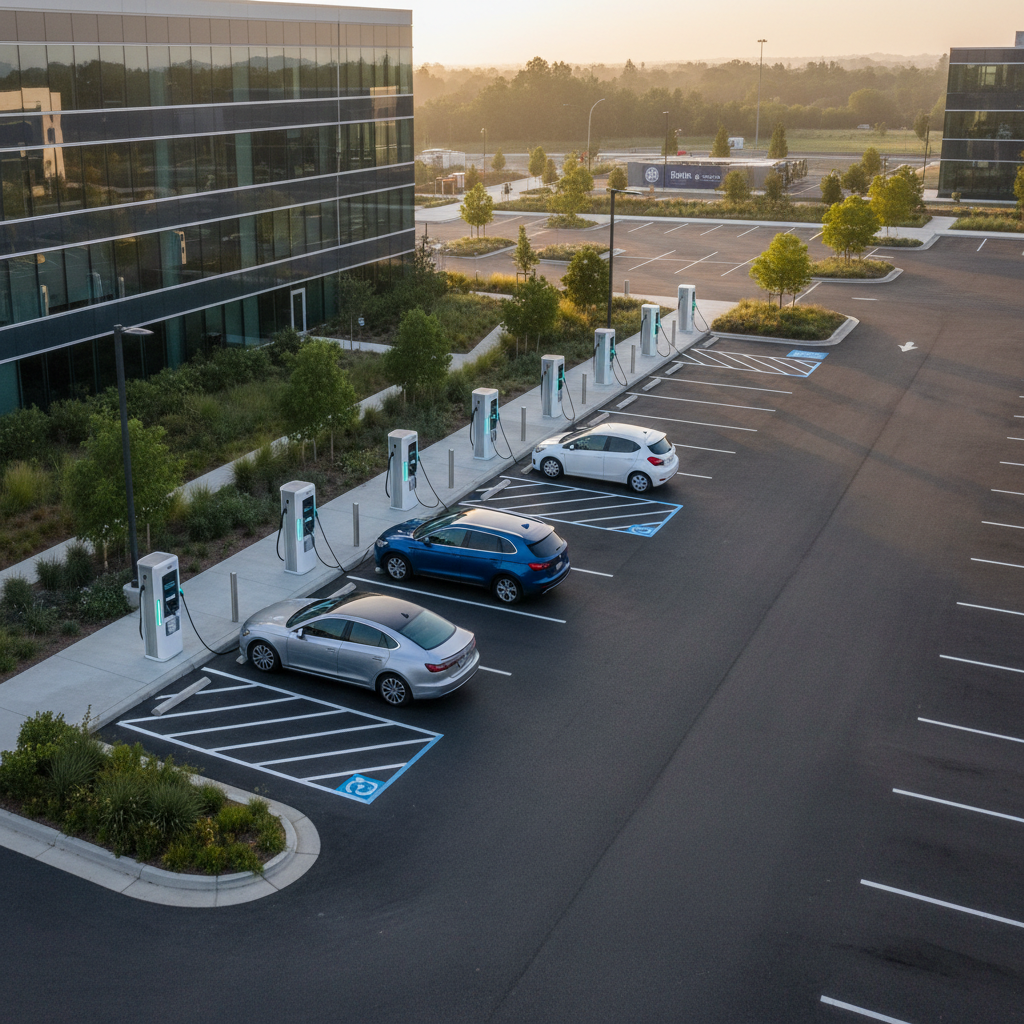
Charging infrastructure is no longer an amenity—it's a revenue center and a differentiator for commercial parking assets. Owners and investors who evaluate the numbers objectively can turn electrification into predictable income, higher utilization and a stronger asset position in lease negotiations.
This analysis breaks down realistic revenue and ROI paths for parking lot EV chargers, comparing Level 2 and DC fast charging economics, installation cost ranges, utilization assumptions and operational levers that change outcomes. Use the models here to test scenarios against your asset, then validate results with the parking revenue calculator.
Why parking lot electrification matters for asset owners
Parking lot electrification affects three measurable line items: operating income, tenant and customer demand, and long-term valuation. As EV adoption continues, a property without chargers risks lower utilization and fewer premium tenants, while a property with well-managed chargers can capture new demand and ancillary fees.
Property owners should treat chargers like other revenue-generating capital investments: forecast cash flow, include operating costs (electricity, maintenance), model utilization curves, and estimate payback and internal rate of return. For valuation impacts, see our guide on What Affects Parking Lot Value? A Property Owner's Guide for how income streams translate to cap rates.
Estimating EV charging revenue: assumptions and simple models
Revenue models vary by charger type and pricing approach. Common models are per-session, per-minute, per-kWh, subscription, or blended host/CPO revenue shares. Start with three assumptions: sessions per day, average revenue per session, and utilization rate. Small changes to utilization create large swings in projected annual revenue.
Example: a conservative Level 2 scenario—10 chargers, average 6 sessions/day per charger, $6 revenue per session (estimate): 10 × 6 × $6 = $360/day, or ~$10,800/month (estimate). Swap that to a busy site—10 chargers, 12 sessions/day, $8/session—results in 10 × 12 × $8 = $960/day, or ~$28,800/month (estimate). These numbers illustrate sensitivity to utilization and pricing.
Use the same transparent approach for DC fast charging: estimate sessions per charger, average kWh delivered per session, and your per-kWh price. If you prefer per-minute pricing, convert average session duration to kWh delivered to compare on an apples‑to‑apples basis.
Parking lot EV chargers: equipment costs and installation factors
Equipment and installation vary widely. Typical ranges (estimates): Level 2 chargers cost about $2,000–$7,000 per port including pedestal and basic wiring; DC fast chargers (DCFC) typically run $50,000–$200,000 per station once site work, transformer upgrades and utility interconnection are included. These ranges exclude large utility incentives or required major service upgrades.
Key cost drivers:
- Available electrical capacity—on-site transformers and service panels
- Trenching, conduit and civil work
- Utility interconnection and demand charge exposure (particularly for DCFC)
- Permitting, ADA access and signage
Because installation costs can dominate, many owners pursue rebates and utility programs that reduce effective capex. Pair cost estimates with your site layout and projected utilization to calculate payback and ROI rather than relying on headline equipment pricing alone.
DC fast charging ROI: a realistic case study
DC fast charging delivers the highest per-session revenue but carries higher capital cost and operating complexity. Consider a single 150 kW DCFC with a total installed cost of $150,000 (estimate). Assume average energy delivered per session 40 kWh, price to customer $0.40/kWh, and electricity cost $0.12/kWh.
Under a mid-use case of 30 sessions/day: gross revenue = 30 × 40 kWh × $0.40 = $480/day, or ~$14,400/month (estimate). Electricity cost = 30 × 40 kWh × $0.12 = $144/day, or ~$4,320/month (estimate). Before fixed costs and demand charges, approximate net margin ≈ $10,080/month (estimate).
If net operating cash flow is ~<$10k/month, the simple payback on a $150k install is ~15 months (estimate). In practice, demand charges, lower utilization on off-peak days and maintenance reduce margins, so model conservative and optimistic cases. Sensitivity analysis on sessions/day and per-kWh pricing is essential.
Level 2 charging income: practical scenarios for lots and garages
Level 2 is operationally simpler and fits many parking operator strategies—especially for commuter, workplace and multi-hour retail parking. Typical session durations are 2–4 hours; pricing often ranges from $1.50–$6.00 per hour or $0.20–$0.35 per kWh depending on market (estimate). Level 2 is less exposed to demand charge volatility.
Scenario: 20 Level 2 ports in a mixed-use garage, average occupancy 50% over a 12-hour day, average session 3 hours, price $4/session (estimate): revenue = 20 × (12 × 0.5 / 3) × $4 = $640/day, or ~$19,200/month (estimate). Subtract electricity and network fees—net can still be several thousand dollars per month, scaling with adoption.
Another operator tactic is subscription or bundled parking + charging. For instance, if premium monthly parking with charging is priced at $85/month and you convert 120 spaces, that's $85/month × 120 spaces = $10,200/month (estimate). Bundling can stabilize cash flow and reduce churn in commercial leases.
Operational levers to maximize utilization and revenue
Three operational levers move the needle: pricing strategy, access control, and partnerships. Pricing can be demand-based (higher for peak), membership-based, or guest-priced. Access control—reserved stalls, permit priority, and enforcement—ensures chargers serve revenue-generating customers.
Strategic partnerships with charge point operators, retail tenants or fleets reduce owner operational burden. Options include:
- Revenue-share host agreements—operator installs and runs chargers; owner earns a portion of gross
- Lease or rent model—owner receives a steady site rent from a CPO
- Self-operated—owner controls pricing and retains all revenue but handles O&M
Also factor in non-energy operating costs: network fees (if using networked chargers), periodic maintenance, and software subscription fees. Adjust your ROI model for these recurring expenses and model scenarios where utility incentives offset CAPEX to improve payback.
Valuation impact: charging as income and as a competitive asset
Charging infrastructure is both a direct income stream and a value enhancer. Under income-capitalization approaches, stable net income from charging increases NOI which, when capitalized, raises asset value. Even a modest additional NOI can change valuation materially at low cap rates common in core urban assets.
Owners should document stabilized revenue, utilization trends, and contractual arrangements. For a thorough approach to converting parking cash flow into valuation estimates, consult our Commercial Parking Lot Revenue Guide. Integrate expected charging income into pro forma models and sensitivity test valuation outcomes across utilization and capex recovery timelines.
Site selection and technical checklist before committing capital
Prior to installation, run a technical checklist: available utility capacity, potential for transformer or service upgrades, trenching complexity, ADA compliance, lighting and security, and preferred charger locations relative to customer flow. Early utility engagement avoids surprise interconnection costs and timelines.
Also model non-financial considerations that affect adoption: signage clarity, payment options, and visibility. In higher-turnover retail environments, chargers need turnover-driving enforcement; in workplace or multifamily assets, convenience and reservation systems matter more.
Final Thoughts
Investing in parking lot EV chargers can deliver material revenue and bolster asset competitiveness, but returns vary by charger type, site characteristics and operational execution. Level 2 systems scale economically for commuter and long-stay use; DC fast charging captures higher per-session revenue but requires careful modeling of demand charges and higher capex.
Run scenarios with conservative and aggressive utilization assumptions, include installation and ongoing operating costs, and consider utility incentives and partnership structures. If your objective is to quantify how charging income integrates with parking operations and asset value, start with a simple, defensible model and iterate with actual usage data post-deployment.
Ready to test your property’s potential? Try the What Is My Parking Worth calculator to see how EV charging revenue assumptions change your parking valuation and expected return.